
Seeka is an integrated horticultural and produce company that grows, processes, distributes and markets high quality produce, such as kiwifruit and avocados, directly to world-leading retailers and wholesalers.
Seeka’s vision is to be New Zealand’s premier produce company. By providing a fully-integrated orchard-to-market service, Seeka grows, picks, packs, cools and supplies high-value products, such as kiwifruit and avocados, directly to world-leading retailers and wholesalers.

In 2018, Seeka identified the urgent need for the business to be able to better provide the very latest hazard data on their orchards to staff and contractors.
The solution needed to swiftly and effectively address the pressing need for enhancing health and safety, but also have the capacity and capability to grow to become a powerful business intelligence tool for the whole organisation.
Orchard, harvest and packing operations are labour intensive. Working across more than 700 orchards brings unique and often changing Health & Safety risks.
With a safety-first focus, Seeka strives to ensure that all their 560 permanent staff, 3000 seasonal staff and 400 external contractors are all kept safe throughout the year.
Seeka had previously introduced tools to help collect, manage and share critical orchard information with staff and contractors. However, because the output of these tools was not available online, in real-time, the information was often out-of-date in terms of the hazards present (such as broken wires, or rabbit holes).
Previously, the key challenges in sharing location critical hazard information at Seeka included:
As this was the first time that Seeka had implemented an online spatial viewer for the business, the project came with certain challenges and complexities such as:
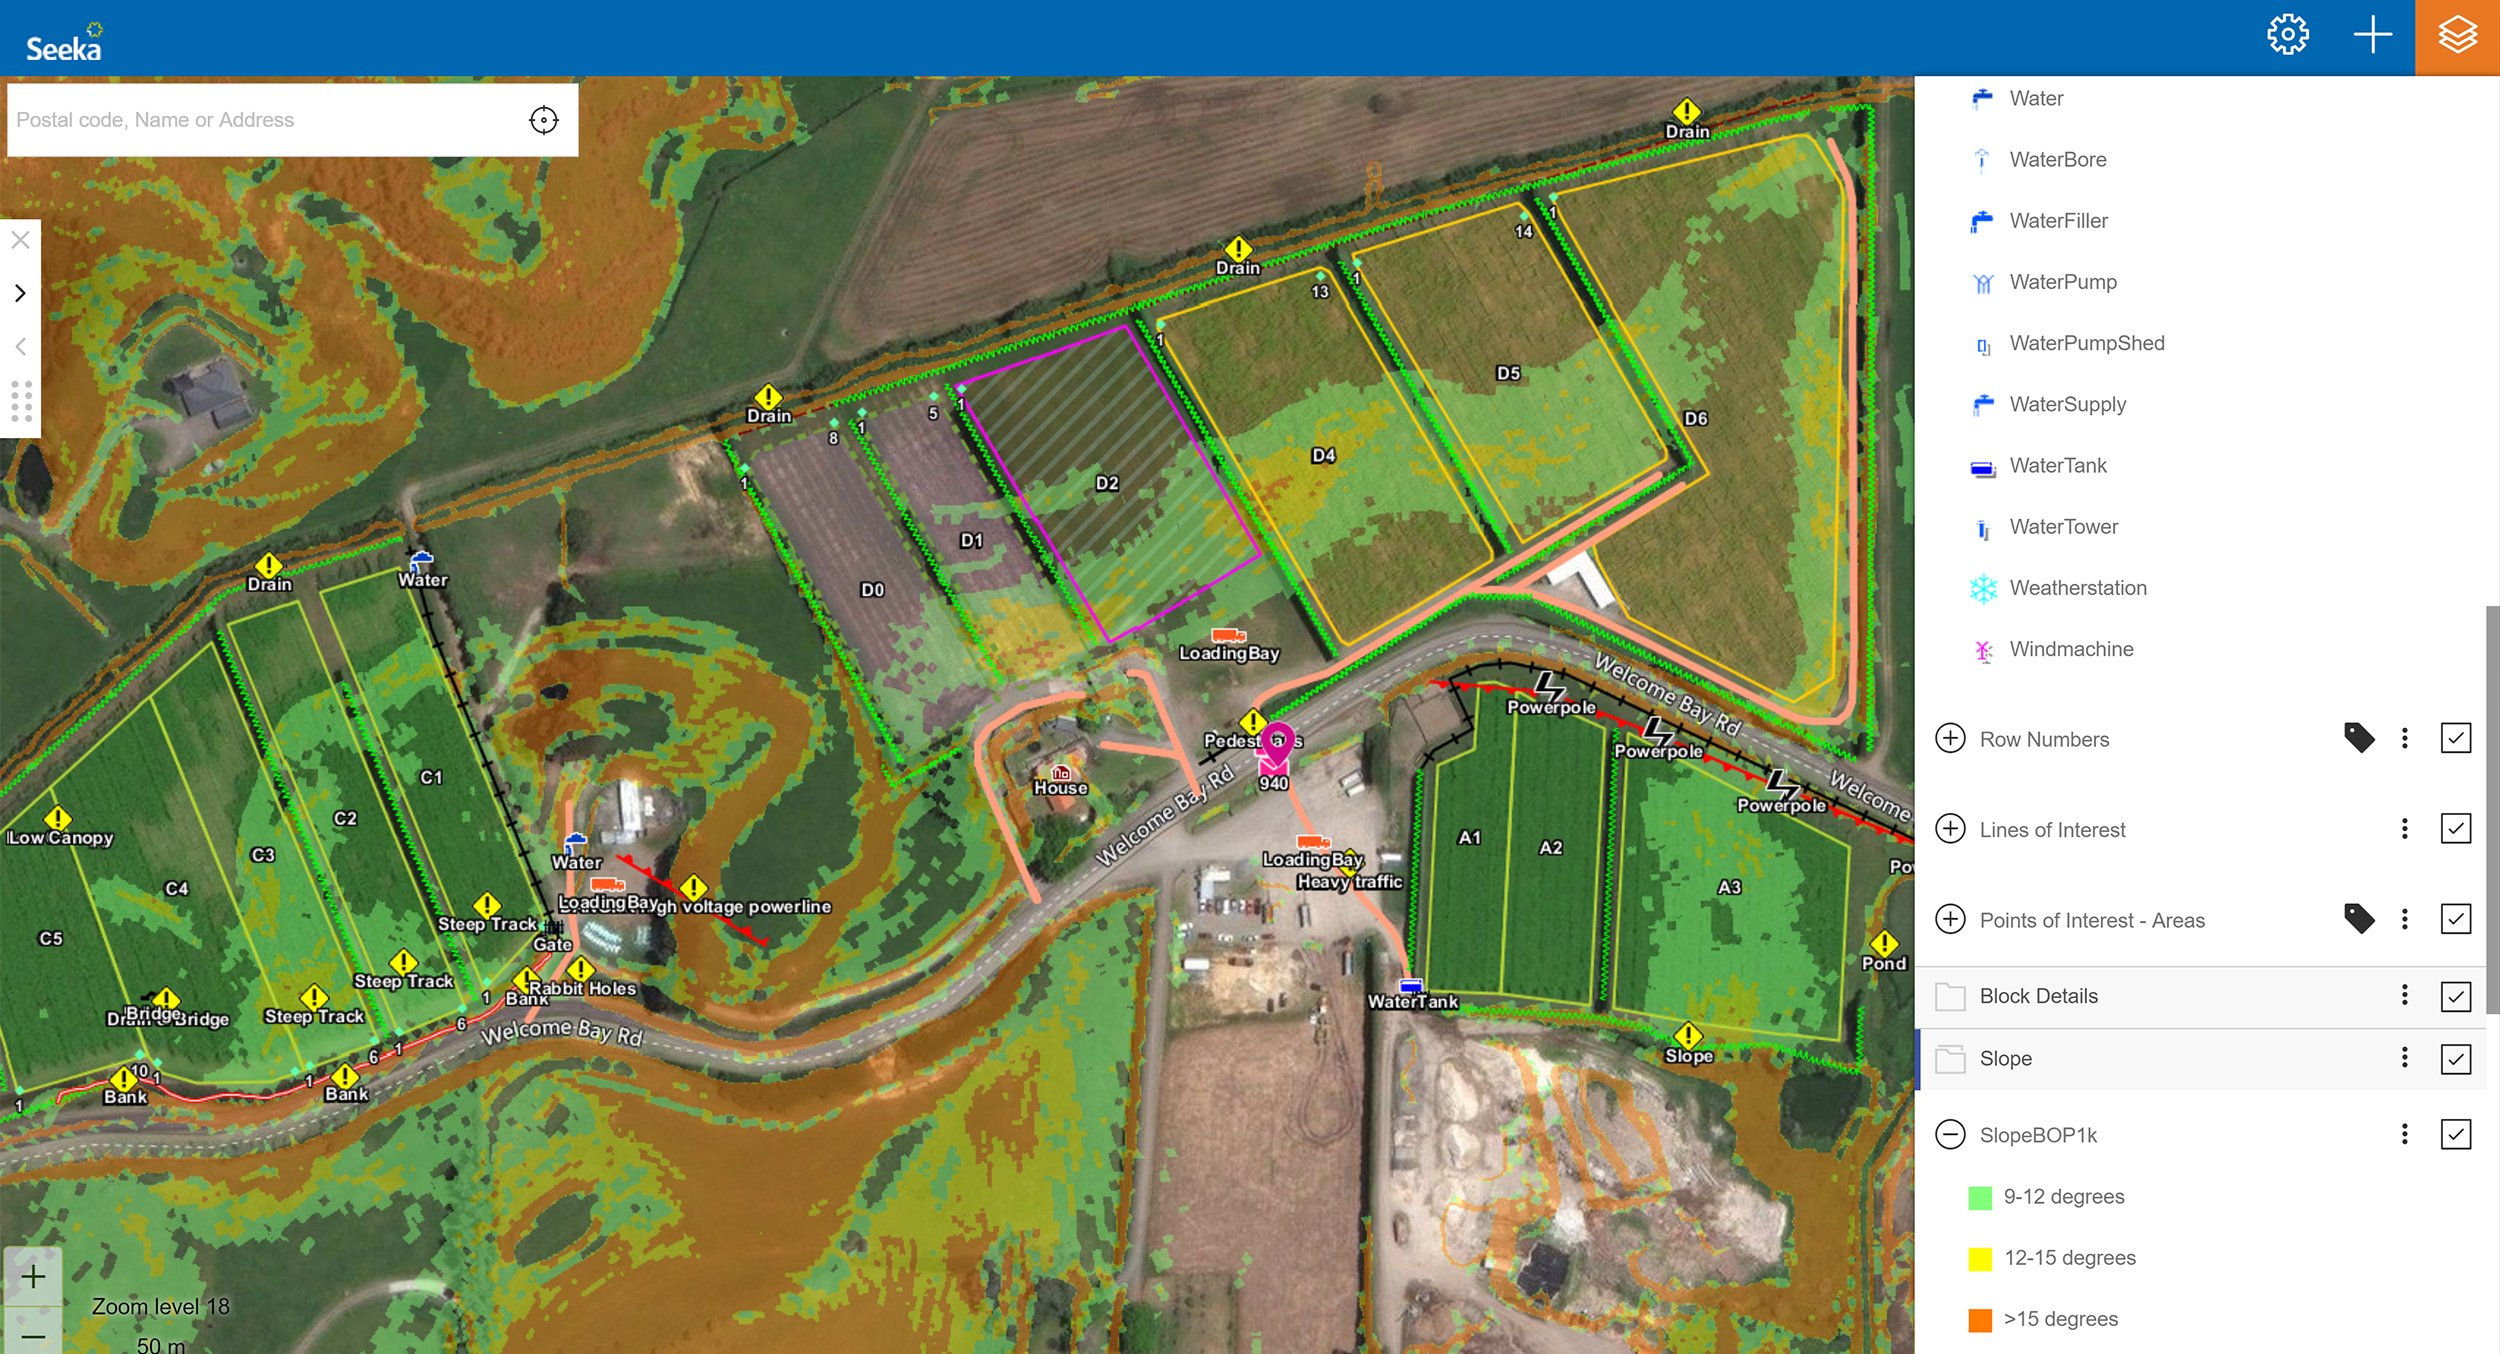
Seeka worked with Critchlow to design and build integration models and layers to represent their orchards’ spatial information. This information was then visualised in Spectrum Spatial by Pitney Bowes to create “Seeka Maps”.
Instead of out-of-date PDF printouts, Seeka staff and contractors now have an up-to-date online map of an orchard’s hazards, including sloping areas to avoid and other important features such as property access, buildings, parking, first aid, toilets and traffic flow.
“Seeka Maps has provided peace of mind when it comes to knowing that the health and safety data they store and share for their orchards is centrally managed and always the most up-to-date that it can be,” says Critchlow’s Jacob Pescini.
Due to the huge success of the initial project, Critchlow are now helping Seeka to integrate additional data layers, features and functionality.
Additional future use cases for improving the ability to share location-based information about the orchards include:
Seeka Maps has helped to substantially improve on-site safety and do away with the use of out-of-date, printed PDF maps. Now, Seeka staff, or contractors simply type in a property’s address on a smartphone or scan a QR code at the orchard entrance to view all hazard and associated data for the orchard.
As Seeka’s Business Solutions Team Leader, Mariki Jovner says, “Now, everyone’s connected to the same information. We know it’s accurate and current - no more old printed maps in the back of the ute to access the orchards!”
Seeka Maps is already widely used across the Seeka ecosystem of head office, growers and contractors here in New Zealand, as well as in Seeka Australia, with approximately 600+ users. However, Seeka see further use cases and applications for Seeka Maps across all their divisions, including; Grower Services, Orchard, Finance, Corporate, Post-Harvest, Commercial, Retail Services, Supply, and Information Systems.
Visualisation of orchards in Seeka Maps currently includes: orchard boundaries, orchard blocks, harvest areas, crop and varieties data. With further integration of Seeka organisational data, Seeka Maps will not only provide the business with even greater visualisation of risk but also opportunity across their operations helping their growers optimise both their yields and orchard returns. “From retail and investor marketing, to better decision making so we grow more efficiently with higher yields. Even through to assisting with the layout of new orchard developments and planning of various blocks, Seeka Maps is a real game-changer,” says Jason Swain, Seeka’s GM of Information Systems.

“From retail and investor marketing, to better decision making so we grow more efficiently with higher yields. Even through to assisting with the layout of new orchard developments and planning of various blocks, Seeka Maps has been a real game-changer.”
Jason Swain
GM Information Systems, Seeka
We promise we won't spam your inbox with unnecessary emails. Privacy Policy